Memory forensics is a powerful tool. All executed code and data passes through RAM which makes it perfect for hunting malware. Most discussion on memory forensics is focused (rightly) on malware analysis, and the benefits of memory forensics for non-malware scenarios have been less publicised.
Often, a lack of understanding of the benefits of memory forensics has pervaded internal investigations or law enforcement. There is a tendency to think, “we’ve got the whole box, so why would we need the memory?”
It is true that registry, prefetch, NTFS metadata, and an array of other artefacts can provide a rich set of data for any investigation; however, certain scenarios can highlight the benefit of memory forensics. In this case study I’ll look at a scenario of a user running Tor Browser Bundle (TBB) on an external USB drive to access webmail, and a Tor hidden service.
If we were reliant on disk forensics we’d still get a great set of artefacts to work with, including:
- Prefetch: what executable was run and when;
- Registry values: shellbags, USB connection data, shimcache entries, most recently run/viewed files;
- Pagefile data; or
- Network artefacts: if the user was operating on a corporate network we may have access to proxy logs, firewall traffic or other systems.
So, with this wide range of artefacts, what is the benefit of capturing memory? Using Volatility and a memory image from a virtual machine, we can find out what data is available to augment an investigation.
Testing scenario
The testing scenario proposed is quite basic. I’ve set up a virtual machine running Windows 10 x64 (Creators Update). My hypothetical user does the following actions:
- Accesses the internet via Edge;
- Searches for ‘Tor Browser’;
- Downloads the TBB installer direct to an NTFS-formatted USB;
- Runs the TBB setup, accepting all the defaults;
- Accesses the internet through the Tor network;
- Checks a GMX email account, and reads a message sent from a Gmail account;
- Copy and pastes a link sent in the email for an ‘ephemeral message’ website which provides a further link to a Tor hidden service (The New York Times https://www.nytimes3xbfgragh.onion/);
- Accesses https://www.nytimes3xbfgragh.onion/ and browses the front page and moves to a second page;
- Returns back to the GMX email tab, copy and paste the Gmail email into new email;
- Writes an email back to the Gmail account; and
- The TBB is closed and the USB pulled.
Is this a contrived example? Probably. If you test it yourself you’re likely to get a different range of artefacts, as different data will potentially be loaded into the memory at the time of the VM snapshot.
I actually took three snapshots, as it’s so easy with virtual machines, it’s better to take more than less:
-rwxrwxrwx 1 root root 4.0G Mar 18 22:27 Win10_14393_Tor_4_Tabs.vmem
-rwxrwxrwx 1 root root 2.5M Mar 18 22:27 Win10_14393_Tor_4_Tabs.vmsn
-rwxrwxrwx 1 root root 4.0G Mar 18 22:20 Win10_14393_Tor_Baseline.vmem
-rwxrwxrwx 1 root root 2.0M Mar 18 22:20 Win10_14393_Tor_Baseline.vmsn
-rwxrwxrwx 1 root root 4.0G Mar 18 22:30 Win10_14393_Tor_Closed.vmem
-rwxrwxrwx 1 root root 2.5M Mar 18 22:30 Win10_14393_Tor_Closed.vmsn
The first snapshot was Win10_14393_Tor_Baseline.vmem (and accompanying .vmsn snapshot file). This was taken after Tor was installed and run, but no other ‘user’ data (like email) was accessed (end of step 5, above).
The second snapshot was Win10_14393_Tor_4_Tabs.vmem. This was taken with four tabs open: GMX webmail, the website ‘Self-Destructing Message’, and two pages from the New York Times hidden service (end of step 8, above).
The last snapshot, Win10_14393_Tor_Closed.vmem is the one that I will predominantly focus on for the memory forensics analysis. It was taken after TBB was closed and a short amount of idle time (after step 11, above).
I also have a baseline image of the Windows 10 RAM with no interaction and a baseline image of a generic instance of Firefox running with no TBB.
Let’s Go!
imageinfo / kdbgscan
Volatility is the de facto tool for memory analysis and a good place to start is imageinfo:
Volatility Foundation Volatility Framework 2.6
INFO    : volatility.debug    : Determining profile based on KDBG search...
          Suggested Profile(s) : Win10x64_10586, Win10x64_14393, Win10x64_16299, Win2016x64_14393,
          Win10x64_15063 (Instantiated with Win10x64_15063)
                     AS Layer1 : SkipDuplicatesAMD64PagedMemory (Kernel AS)
                     AS Layer2 : VMWareMetaAddressSpace (Unnamed AS)
                     AS Layer3 : FileAddressSpace (/mnt/c/BoH/Win10_14393_Tor_Closed.vmem)
                      PAE type : No PAE
                           DTB : 0x1aa000L
                          KDBG : 0xf802d38f4500L
          Number of Processors : 2
     Image Type (Service Pack) : 0
                KPCR for CPU 0 : 0xfffff802d3946000L
                KPCR for CPU 1 : 0xffffc00129beb000L
             KUSER_SHARED_DATA : 0xfffff78000000000L
           Image date and time : 2018-03-18 11:29:43 UTC+0000
     Image local date and time : 2018-03-18 22:29:43 +1100
There are no real surprises as I already know the installation is Windows 10x64 version 14393 (Creators Update). kdbgscan could also be used to review the possible profiles and provide more detailed information:
Volatility Foundation Volatility Framework 2.6
**************************************************
Instantiating KDBG using: Unnamed AS Win10x64_14393 (6.4.14393 64bit)
Offset (V)                    : 0xf802d38f4500
Offset (P)                    : 0x13bef4500
KdCopyDataBlock (V)           : 0xf802d37d4fb8
Block encoded                 : Yes
Wait never                    : 0x56c003002cc6d966
Wait always                   : 0xb31b3986b00580
KDBG owner tag check          : True
Profile suggestion (KDBGHeader): Win10x64_14393
Version64                     : 0xf802d38f6cf8 (Major: 15, Minor: 14393)
Service Pack (CmNtCSDVersion) : 0
Build string (NtBuildLab)     : 14393.447.amd64fre.rs1_release_i
PsActiveProcessHead           : 0xfffff802d39033d0 (59 processes)
PsLoadedModuleList            : 0xfffff802d3909060 (176 modules)
KernelBase                    : 0xfffff802d3604000 (Matches MZ: True)
Major (OptionalHeader)        : 10
Minor (OptionalHeader)        : 0
KPCR                          : 0xfffff802d3946000 (CPU 0)
KPCR                          : 0xffffc00129beb000 (CPU 1)
***************************************************
**snipped**
Checking baseline data
The additional memory images provide a good framework to look at ‘normal’ TBB use. A pstree against the snapshot with Tor running indicates that processes of interest will be firefox.exe and tor.exe:
dfir@LAPTOP:/mnt/c/BoH$ vol.py -f Win10_14393_Tor_4_Tabs.vmem --profile=Win10x64_14393 pstree | egrep "firefox.exe|tor.exe"
Volatility Foundation Volatility Framework 2.6
...... 0xffff80814dd70080:firefox.exe                7960   3320     50      0 2018-03-18 11:16:46 UTC+0000
....... 0xffff80814e396080:firefox.exe               7924   7960     22      0 2018-03-18 11:19:29 UTC+0000
....... 0xffff80814f5b4800:tor.exe                   3552   7960      4      0 2018-03-18 11:16:51 UTC+0000
....... 0xffff80814e56c080:firefox.exe               3876   7960      0 ------ 2018-03-18 11:16:53 UTC+0000
psscan
Unlike pslist or pstree, the plugin psscan can detect previously terminated processes. In this case firefox.exe was detected as exited at the time that I shut it down.
dfir@LAPTOP:/mnt/c/BoH$ vol.py -f Win10_14393_Tor_Closed.vmem --profile=Win10x64_14393 pstree | egrep "firefox.exe|tor.exe"
Volatility Foundation Volatility Framework 2.6
...... 0xffff80814dd70080:firefox.exe                7960   3320      0 ------ 2018-03-18 11:16:46 UTC+0000
This is of some assistance, mostly if the computer that you are examining doesn’t have Firefox installed then it is an indicator that it was potentially run from an external device (or perhaps there is another executable on the system called firefox.exe!)
The other relevant executable in this scenario, tor.exe, was not present in the list of processes.
netscan
netscan will display network connections. Again, looking at ‘normal’ TBB behaviour identified a large number of connections via firefox.exe and tor.exe. For our test case snapshot, Volatility picked up both closed firefox.exe and tor.exe connections; a total of 134.
dfir@LAPTOP:/mnt/c/BoH$ vol.py -f Win10_14393_Tor_Closed.vmem --profile=Win10x64_14393 netscan | egrep "firefox.exe|tor.exe"
Volatility Foundation Volatility Framework 2.6
0x80814c899ab0     TCPv4    127.0.0.1:9150                 127.0.0.1:51014      CLOSED           3552     tor.exe        2018-03-18 11:26:53 UTC+0000
0x80814c8cb8b0     TCPv4    192.168.241.133:50630          54.37.17.235:9001    CLOSED           3552     tor.exe        2018-03-18 11:18:59 UTC+0000
0x80814cafb470     TCPv4    127.0.0.1:51099                127.0.0.1:9150       CLOSED           7960     firefox.exe    2018-03-18 11:29:18 UTC+0000
0x80814d8e4170     TCPv4    127.0.0.1:50411                127.0.0.1:9151       CLOSED           7960     firefox.exe    2018-03-18 11:16:51 UTC+0000
0x80814dfffa00     TCPv4    127.0.0.1:9150                 127.0.0.1:50983      CLOSED           3552     tor.exe        2018-03-18 11:26:48 UTC+0000
0x80814e09f010     TCPv4    127.0.0.1:50862                127.0.0.1:9150       CLOSED           7960     firefox.exe    2018-03-18 11:24:35 UTC+0000
0x80814e643010     TCPv4    127.0.0.1:9151                 127.0.0.1:50663      CLOSED           3552     tor.exe        2018-03-18 11:19:29 UTC+0000
0x80814e774180     TCPv4    127.0.0.1:51106                127.0.0.1:9150       CLOSED           7960     firefox.exe    2018-03-18 11:29:26 UTC+0000
0x80814e923d00     TCPv4    127.0.0.1:50667                127.0.0.1:50666      CLOSED           7924     firefox.exe    2018-03-18 11:19:29 UTC+0000
0x80814e943100     TCPv4    127.0.0.1:9150                 127.0.0.1:51067      CLOSED           3552     tor.exe        2018-03-18 11:28:13 UTC+0000
0x80814ec65010     TCPv4    127.0.0.1:51049                127.0.0.1:9150       CLOSED           7960     firefox.exe    2018-03-18 11:27:57 UTC+0000
**snipped**
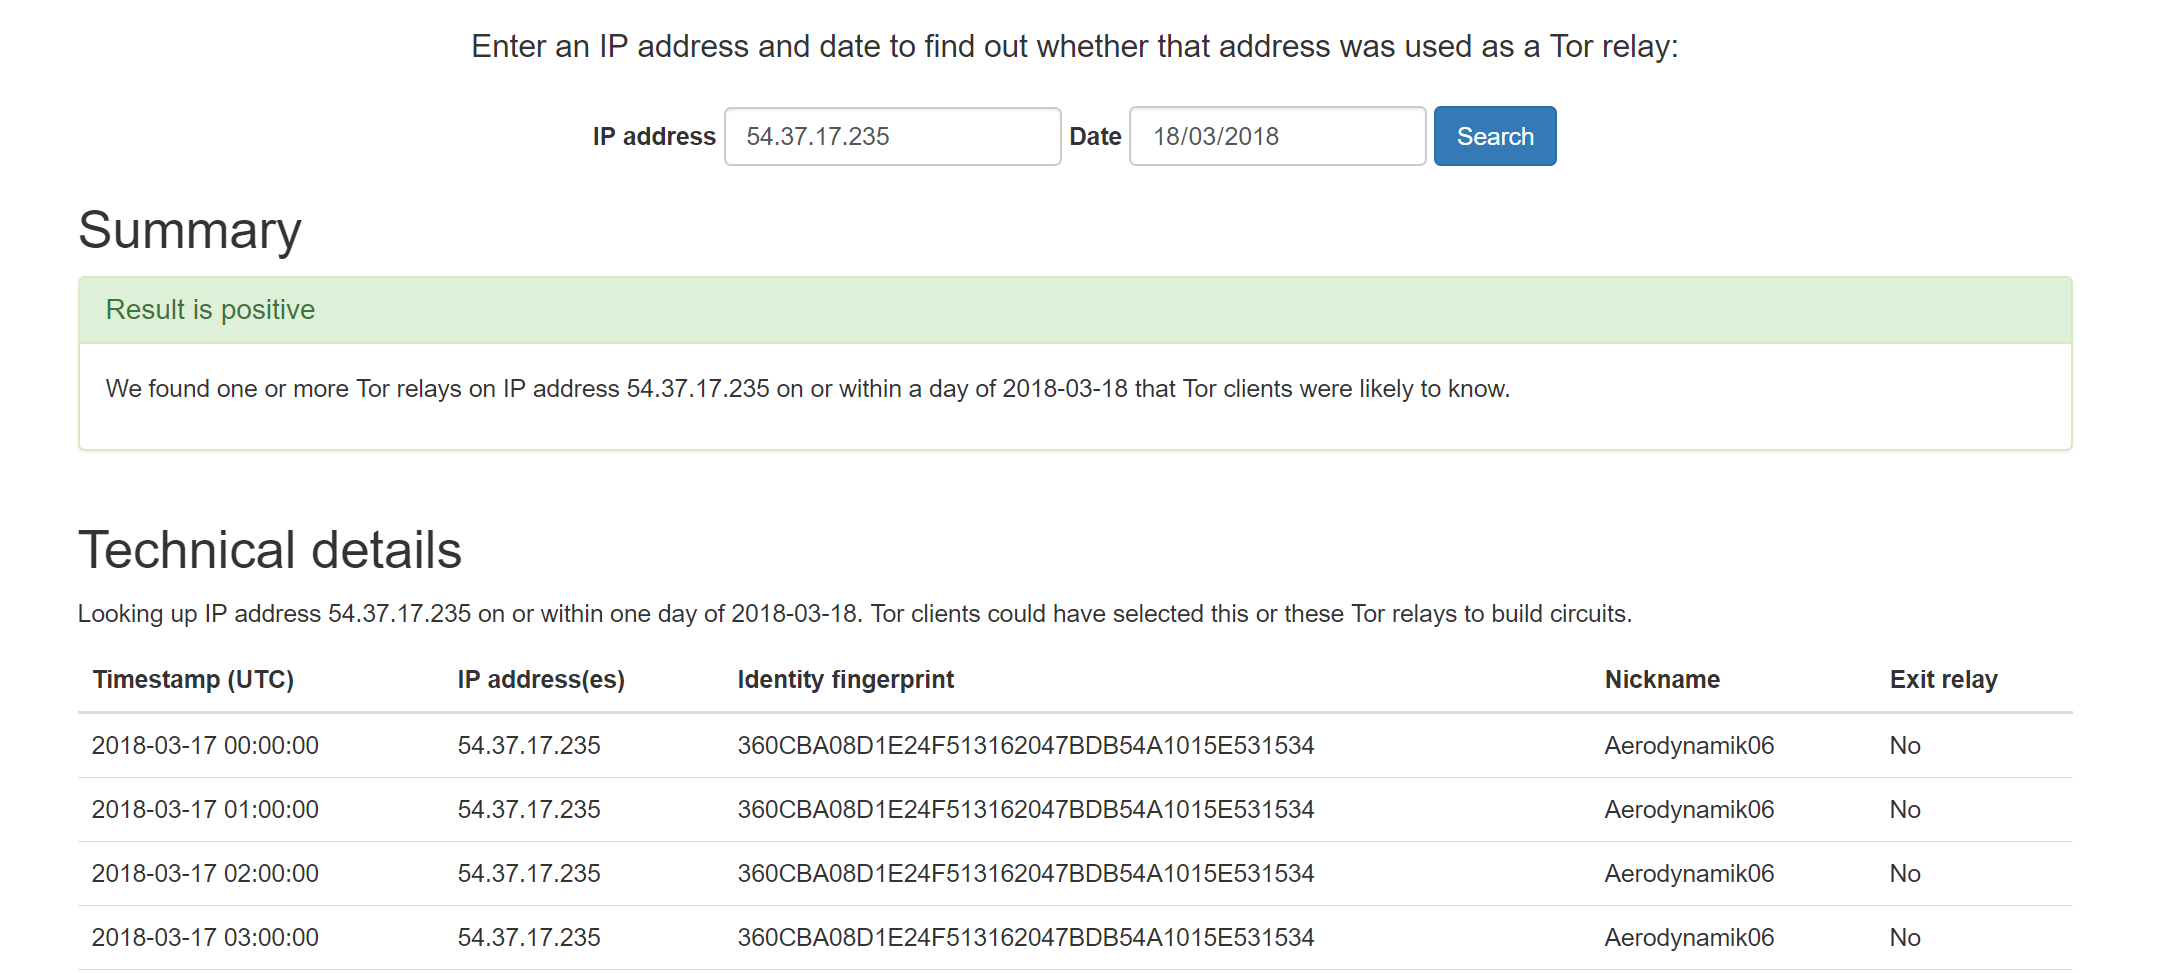
tor.exe indicates a closed destination IP of 54.37.17.235 on port 9001. According to Tor documentation1, port 9001 is require for Tor to connect to the network.
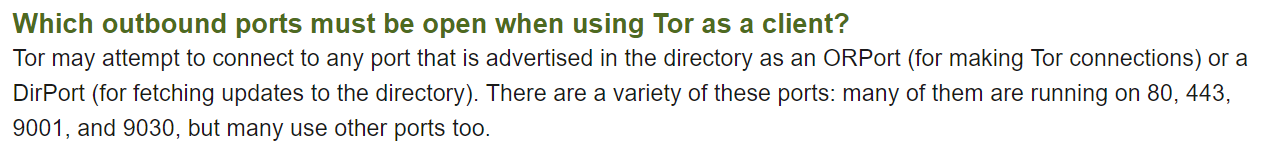
In our case, we can confirm that it was a Tor node and thus the computer in question did connect at least one hop to the Tor network.
To confirm this assumption, I ran a standard installation of Firefox on a clean VM under a new snapshot path (i.e the base Windows installation without TBB ever downloaded or installed). The netscan only had traffic on port 80 and 443 as you would expect for HTTP(S) traffic. No netscan data was identified for port 9150.
dfir@LAPTOP:/mnt/c/BoH$ vol.py -f Win10_14393_No_Tor_Firefox_Closed.vmem --profile=Win10x64_14393 netscan | grep :9150
Volatility Foundation Volatility Framework 2.6
dfir@LAPTOP:/mnt/c/BoH$
firefoxhistory
Credit to superponible for writing plugins for firefox history, downloads and cookies (as well as a bunch of others). Not surprisingly, given TBB is configured not to save browsing history, the result of the plugins firefoxhistory and firefoxcookies are thin.
dfir@LAPTOP:/mnt/c/BoH$ vol.py --plugins=/usr/lib/python2.7/dist-packages/volatility/plugins -f Win10_14393_Tor_Closed.vmem firefoxhistory | awk '{print $1, $2}'
Volatility Foundation Volatility Framework 2.6
ID URL
------ --------------------------------------------------------------------------------
4 place:type=6&sort=14&maxResults=1
3 place:sort=8&maxResults=1
2 https://blog.torproject.org
1 https://www.torproject.org
However, again, the presence of the standard Tor history is a further indicator reinforcing the hypothesis a user was accessing the Tor network. Its counterpart plugin, firefoxcookies, did not yield any additional useable data.
usbstor
One key plugin to use in this scenario is usbstor by James Hall and Kevin Breen which scans memory for registry artefacts relating to USB devices.
I did attempt to use usbstor with no success. This demonstrates there is an element of luck with memory forensics as no registry info specific to USB artefacts appeared to be in the memory snapshot. Even dumping the registry files and parsing with Registry Explorer, Regripper and manual review didn’t identify artefacts relating to my Lexar USB drive.
So with this missing artefact, how can we link (and hopefully locate) the USB drive?
mftparser
I cheated slightly on this experiment by deliberately formatting the USB with NTFS, knowing that I could run the mftparser plugin and see the results. While FAT32 still dominates USB drives, as USB and portable drives are getting larger, it is more and more common to see NTFS as the file system.
mftparser can extract $MFT records from memory. Its output looks as follows:
Scanning for MFT entries and building directory, this can take a while
***************************************************************************
MFT entry found at offset 0xa400
Attribute: In Use & File
Record Number: 0
Link count: 1


$STANDARD_INFORMATION
Creation                       Modified                       MFT Altered                    Access Date                    Type
------------------------------ ------------------------------ ------------------------------ ------------------------------ ----
2018-03-08 03:37:02 UTC+0000 2018-03-08 03:37:02 UTC+0000   2018-03-08 03:37:02 UTC+0000   2018-03-08 03:37:02 UTC+0000   Hidden & System

$FILE_NAME
Creation                       Modified                       MFT Altered                    Access Date                    Name/Path
------------------------------ ------------------------------ ------------------------------ ------------------------------ ---------
2018-03-08 03:37:02 UTC+0000 2018-03-08 03:37:02 UTC+0000   2018-03-08 03:37:02 UTC+0000   2018-03-08 03:37:02 UTC+0000   $MFT

$DATA


$OBJECT_ID
Object ID: 40000000-0000-0000-0000-540600000000
Birth Volume ID: 00005406-0000-0000-0000-540600000000
Birth Object ID: 32406500-000c-0000-b000-000058000000
Birth Domain ID: 01004000-0000-0500-0000-000000000000

***************************************************************************
***************************************************************************
**snipped**
In a total of 317 $MFT file entries were identified linked to the path containing ‘Tor Browser’.
dfir@LAPTOP:/mnt/c/BoH$ cat mftparser.txt | egrep "Tor Browser" | cut -f14-20 -d ' '
2018-03-18 11:19:30 UTC+0000   Tor Browser\Browser\TorBrowser\Data\Browser\profile.default\mimeTypes-1.rdf
2018-03-18 11:19:32 UTC+0000   Tor Browser\Browser\TorBrowser\Data\Browser\Caches\profile.default\safebrowsing\test-flashallow-simple.pset
2018-03-18 11:19:28 UTC+0000   Tor Browser\Browser\TorBrowser\Data\Browser\profile.default\sessionCheckpoints.json.tmp
2018-03-18 11:19:29 UTC+0000   Tor Browser\Browser\TorBrowser\Data\Browser\profile.default\prefs-1.js
2018-03-18 11:19:27 UTC+0000   Tor Browser\Browser\TorBrowser\Data\Browser\profile.default\content-prefs.sqlite-journal
2018-03-18 11:19:32 UTC+0000   Tor Browser\Browser\TorBrowser\Data\Browser\Caches\profile.default\safebrowsing\test-malware-simple.pset
2018-03-08 03:37:08 UTC+0000   Tor Browser\Browser\TorBrowser\Data\Browser\profile.default\extensions\ko-kr.xml
**snipped**
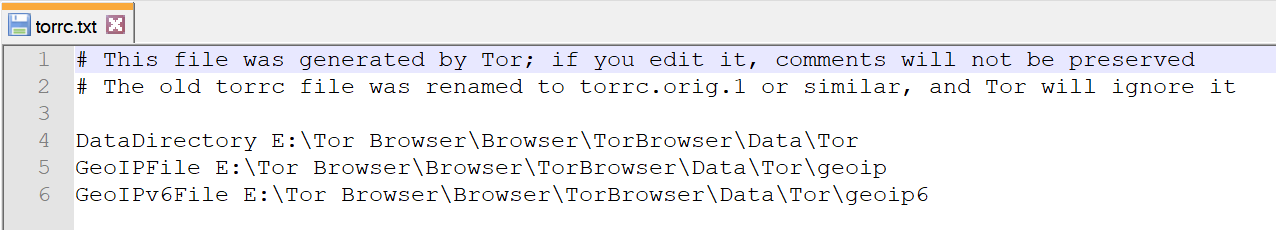
One file that is interesting for the TBB is the torrc file, which normally resides at ‘\Tor Browser\Browser\TorBrowser\Data\Tor\torrc’ and contains configuration information, including location that TBB was executed. What is interesting is that this file is also not normally a large file, which means that it would be stored as a resident file within the $MFT record itself. Reviewing the mftparser output we can first locate any instances of the torrc file:
dfir@LAPTOP:/mnt/c/BoH$ cat mftparser.txt | grep -F "Data\Tor\torrc"
2018-03-18 11:17:05 UTC+0000 2018-03-18 11:17:05 UTC+0000   2018-03-18 11:17:05 UTC+0000   2018-03-18 11:17:05 UTC+0000   Tor Browser\Browser\TorBrowser\Data\Tor\torrc.tmp
2018-03-18 11:15:48 UTC+0000 2018-03-18 11:15:48 UTC+0000   2018-03-18 11:15:48 UTC+0000   2018-03-18 11:15:48 UTC+0000   Tor Browser\Browser\TorBrowser\Data\Tor\torrc-defaults
2018-03-18 11:17:05 UTC+0000 2018-03-18 11:17:05 UTC+0000   2018-03-18 11:17:05 UTC+0000   2018-03-18 11:17:05 UTC+0000   Tor Browser\Browser\TorBrowser\Data\Tor\torrc
2000-01-01 00:00:00 UTC+0000 2000-01-01 00:00:00 UTC+0000   2018-03-18 11:15:48 UTC+0000   2018-03-18 11:15:48 UTC+0000   Tor Browser\Browser\TorBrowser\Data\Tor\torrc.orig.1
And then by refining the grep search to include some lines before and after the match we can locate the resident data from the $MFT entry:
MFT entry found at offset 0x7df32800
Attribute: In Use & File
Record Number: 222
Link count: 1


$STANDARD_INFORMATION
Creation                       Modified                       MFT Altered                    Access Date                    Type
------------------------------ ------------------------------ ------------------------------ ------------------------------ ----
2018-03-18 11:17:05 UTC+0000 2018-03-18 11:17:05 UTC+0000   2018-03-18 11:17:05 UTC+0000   2018-03-18 11:17:05 UTC+0000   Archive

$FILE_NAME
Creation                       Modified                       MFT Altered                    Access Date                    Name/Path
------------------------------ ------------------------------ ------------------------------ ------------------------------ ---------
2018-03-18 11:17:05 UTC+0000 2018-03-18 11:17:05 UTC+0000   2018-03-18 11:17:05 UTC+0000   2018-03-18 11:17:05 UTC+0000   Tor Browser\Browser\TorBrowser\Data\Tor\torrc

$DATA
0000000000: 23 20 54 68 69 73 20 66 69 6c 65 20 77 61 73 20   #.This.file.was.
0000000010: 67 65 6e 65 72 61 74 65 64 20 62 79 20 54 6f 72   generated.by.Tor
0000000020: 3b 20 69 66 20 79 6f 75 20 65 64 69 74 20 69 74   ;.if.you.edit.it
0000000030: 2c 20 63 6f 6d 6d 65 6e 74 73 20 77 69 6c 6c 20   ,.comments.will.
0000000040: 6e 6f 74 20 62 65 20 70 72 65 73 65 72 76 65 64   not.be.preserved
0000000050: 0d 0a 23 20 54 68 65 20 6f 6c 64 20 74 6f 72 72   ..#.The.old.torr
0000000060: 63 20 66 69 6c 65 20 77 61 73 20 72 65 6e 61 6d   c.file.was.renam
0000000070: 65 64 20 74 6f 20 74 6f 72 72 63 2e 6f 72 69 67   ed.to.torrc.orig
0000000080: 2e 31 20 6f 72 20 73 69 6d 69 6c 61 72 2c 20 61   .1.or.similar,.a
0000000090: 6e 64 20 54 6f 72 20 77 69 6c 6c 20 69 67 6e 6f   nd.Tor.will.igno
00000000a0: 72 65 20 69 74 0d 0a 0d 0a 44 61 74 61 44 69 72   re.it....DataDir
00000000b0: 65 63 74 6f 72 79 20 45 3a 5c 54 6f 72 20 42 72   ectory.E:\Tor.Br
00000000c0: 6f 77 73 65 72 5c 42 72 6f 77 73 65 72 5c 54 6f   owser\Browser\To
00000000d0: 72 42 72 6f 77 73 65 72 5c 44 61 74 61 5c 54 6f   rBrowser\Data\To
00000000e0: 72 0d 0a 47 65 6f 49 50 46 69 6c 65 20 45 3a 5c   r..GeoIPFile.E:\
00000000f0: 54 6f 72 20 42 72 6f 77 73 65 72 5c 42 72 6f 77   Tor.Browser\Brow
0000000100: 73 65 72 5c 54 6f 72 42 72 6f 77 73 65 72 5c 44   ser\TorBrowser\D
0000000110: 61 74 61 5c 54 6f 72 5c 67 65 6f 69 70 0d 0a 47   ata\Tor\geoip..G
0000000120: 65 6f 49 50 76 36 46 69 6c 65 20 45 3a 5c 54 6f   eoIPv6File.E:\To
0000000130: 72 20 42 72 6f 77 73 65 72 5c 42 72 6f 77 73 65   r.Browser\Browse
0000000140: 72 5c 54 6f 72 42 72 6f 77 73 65 72 5c 44 61 74   r\TorBrowser\Dat
0000000150: 61 5c 54 6f 72 5c 67 65 6f 69 70 36 0d 0a         a\Tor\geoip6..

***************************************************************************
***************************************************************************
Using a hex editor, the $MFT entry can be carved from the image from offset 0x7df32800. The data recovered confirms the path, including the volume letter, TBB was executed, and if any other options were manually configured. The timestamps on this file can be used to accurately pivot back and forward in an attempt reconstruct user activity through any timeline analysis.
Other plugins
Some plugins didn’t identify any useful data: shellbags, shimcache, userassist, or clipboard. It is definitely not consistent, as earlier testing that I have done with TBB memory images did identify at least some shellbag data. This data however is registry based and can be pulled separately from the disk.
Next Steps
An additional Volatility plugin that might be useful includes timeliner; however, based on network connections, and exited processes we can say with good confidence that TBB was run on the system prior to the memory image being taken.
Using the date and time from the torrc file we can determine when Tor was executed and from what volume. This could be matched with prefetch files from the hard drive and then registry entries for the USB. These entries could then give us the make and model of the USB. For law enforcement, this could provide additional information on hidden services accessed. For corporate environments, this can assist in identifying suspicious or unwanted user behaviour.
In a forthcoming part 2 of this post, I’ll look at Bulk Extractor to pull out additional data from this memory image.
Please feel free to provide any questions, comments, or corrections at [email protected] or via Twitter @mattnotmax.
##Related Links: The Volatility Foundation Volatility Github The Art of Memory Forensics Tor Project