In my previous post I used Volatility to examine a memory image from a hypothetical Tor user accessing webmail, the internet, and a Tor hidden service. From that analysis I could ascertain with good confidence a user of the operating system connected to the Tor network from a USB on drive E:.
In this post, I will continue with the same memory image but see what additional information can be revealed from data carving tools.
Bulk Extractor
Bulk Extractor uses ‘scanners’ to carve data of interest from either memory or disk images without relying on the file system. This can include URLs, emails, credit card numbers, IP addresses, network traffic and much more.
There is an extensive range of options available to tune the processing to your needs by enabling or disabling the various scanners. This might be necessary if you are limited by what you are allowed to search for, or have a large disk image. However, running Bulk Extractor with default options is straightforward against a small memory image such as ours: bulk_extractor -o <output directory> <source file>.
dfir@LAPTOP:/mnt/c/BoH$ bulk_extractor -o output Win10_14393_Tor_Closed.vmem
bulk_extractor version: 1.5.5
Hostname: LAPTOP
Input file: Win10_14393_Tor_Closed.vmem
Output directory: output
Disk Size: 4294967296
Threads: 8
Attempt to open Win10_14393_Tor_Closed.vmem
15:43:18 Offset 67MB (1.56%) Done in  0:00:17 at 15:43:35
15:43:30 Offset 150MB (3.52%) Done in  0:05:30 at 15:49:00
15:43:32 Offset 234MB (5.47%) Done in  0:04:08 at 15:47:40
***snipped***
15:51:38 Offset 4177MB (97.27%) Done in  0:00:14 at 15:51:52
15:51:45 Offset 4261MB (99.22%) Done in  0:00:03 at 15:51:48
All data are read; waiting for threads to finish...
Time elapsed waiting for 8 threads to finish:
     (timeout in 60 min.)
All Threads Finished!
Producer time spent waiting: 470.968 sec.
Average consumer time spent waiting: 0.481216 sec.
*******************************************
** bulk_extractor is probably CPU bound. **
**    Run on a computer with more cores  **
**      to get better performance.       **
*******************************************
MD5 of Disk Image: 01b135f50fefa0de0a58704b6649e174
Phase 2. Shutting down scanners
Phase 3. Creating Histograms
Elapsed time: 516.226 sec.
Total MB processed: 4294
Overall performance: 8.31994 MBytes/sec (1.03999 MBytes/sec/thread)
Total email features found: 1103
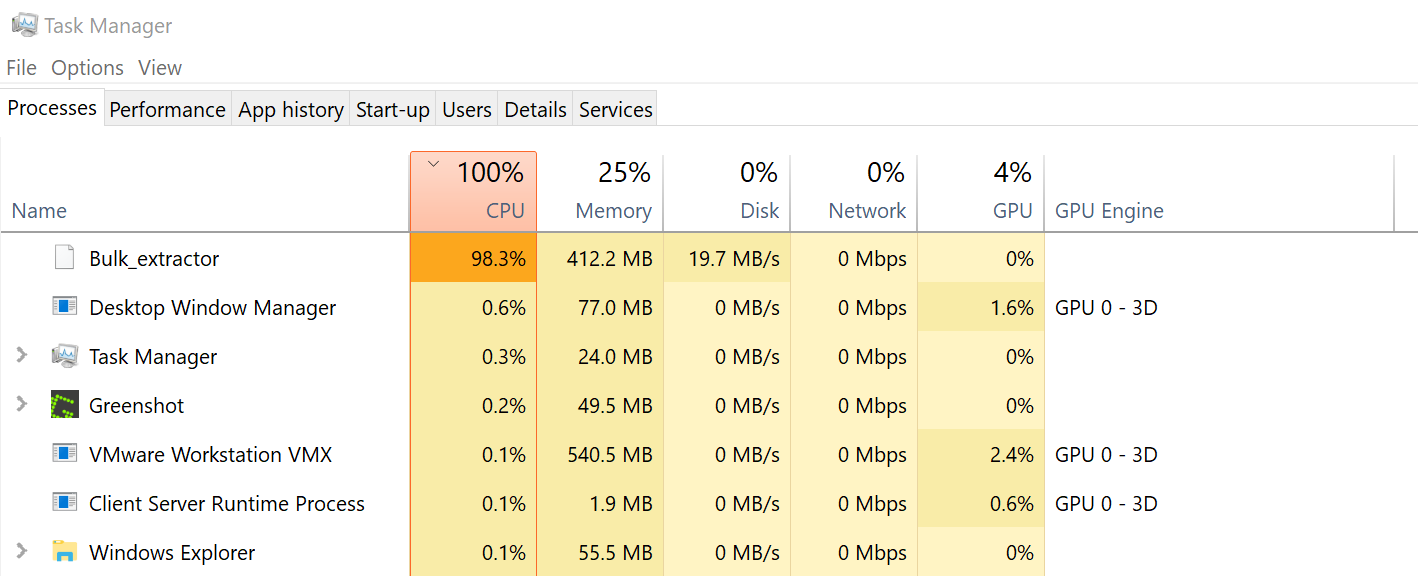
The beauty (or fallacy!) of Bulk Extractor is it will use ~95% CPU to get the job done. This is great, but don’t expect to multi-task, especially over a big image.

The output is placed into the specified directory and split into various text files.
dfir@LAPTOP:/mnt/c/BoH/output$ ls -sSh
total 153M
 60M windirs.txt            56K url_services.txt               0 jpeg_carved.txt              0 gps.txt
 59M url.txt                28K ip.txt                         0 telephone_histogram.txt      0 httplogs.txt
 25M domain.txt             24K ether.txt                      0 ether_histogram.txt          0 kml.txt
7.2M winpe.txt              16K email_histogram.txt            0 ip_histogram.txt             0 pii_teamviewer.txt
1.1M json.txt              8.0K sqlite_carved.txt              0 ccn_histogram.txt            0 rar.txt
952K zip.txt               8.0K aes_keys.txt                   0 url_searches.txt             0 unrar_carved.txt
472K url_histogram.txt     4.0K email_domain_histogram.txt     0 url_facebook-address.txt     0 unzip_carved.txt
304K packets.pcap          4.0K telephone.txt                  0 alerts.txt                   0 url_facebook-id.txt
188K email.txt             4.0K exif.txt                       0 ccn_track2_histogram.txt     0 url_microsoft-live.txt
148K rfc822.txt            1.0K ccn.txt                        0 ccn_track2.txt               0 vcard.txt
 80K winlnk.txt               0 jpeg_carved                    0 elf.txt                      0 winprefetch.txt
 80K domain_histogram.txt     0 sqlite_carved                  0 find_histogram.txt
 64K report.xml               0 pii.txt                        0 find.txt
From the memory image, Bulk Extractor has identified 153 MB of data; however, most of this data is from a select few files. Because there is so much data the problem is actually going to be looking through it and ascertaining its meaning within the memory image (if that is at all possible).
This brings the analysis to an important point. In this contrived scenario, the web browsing is solely from one known session; however, this cannot be assumed in a real investigation. Any artefact from Bulk Extractor should simply be treated as an indicator. Just because a URL or email address is in the output doesn’t mean that our hypothetical user accessed it, or it’s relevant in any way.
Searching for Tor hidden services
Given the background to this investigation, we know that a user accessed the Tor network, so a logical start would be to grep in url.txt for ‘onion’ to determine if Tor hidden services were recorded in the memory image.
dfir@LAPTOP:/mnt/c/BoH/output$ cat url.txt | grep "onion"
339718862       https://www.nytimes3xbfgragh.onion/     \x00\x00M\x00\x00\x00\x08\x00\x00\x00\x01%\x00\x00\x00 https://www.nytimes3xbfgragh.onion/\x00\x00\x00\x00\x00\x00\x00\x00\x00\x00\x00\x00\x00\x00\x00\x00
462190668       https://www.nytimes3xbfgragh.onion/     \xBB\x01\x00\x00\x00\x00\x00\x00#\x00\x00\x00\x00\x00\x00\x00https://www.nytimes3xbfgragh.onion/\xBF\x00\x00\x00\x00\x00\x00\x00\x00\x05\x00\x00\x00\x08\x00\x00
458557510-ZIP-1599      https://3g2upl4pq6kufc4m.onion  POST" template="https://3g2upl4pq6kufc4m.onion">\x0A  Param name
458557510-ZIP-1693      https://3g2upl4pq6kufc4m.onion  rl\x0ASearchForm https://3g2upl4pq6kufc4m.onion /SearchForm>\x0A/
583230264       https://www.nytimes3xbfgragh.onion/2018/03/17/world/asia/us-technology-smuggling-foreign-weapons.html?action=click&module=In%20Other%20News&pgtype=Homepage&action=click&module=Latest&pgtype=Homepage     \xBB\x01\x00\x00\x00\x00\x00\x00\xC6\x00\x00\x00\x00\x00\x00\x00https://www.nytimes3xbfgragh.onion/2018/03/17/world/asia/us-technology-smuggling-foreign-weapons.html?action=click&module=In%20Other%20News&pgtype=Homepage&action=click&module=Latest&pgtype=Homepage\xBF\xBF\x00\x00\x00\x00\x00\x00\x00\x00\x05\x00\x00\x00\x08\x00
739017720       https://www.nytimes3xbfgragh.onion      6\x00\x00\x00\x03\x00\xFF\xFF"\x00\x00\x80\x04\x00\xFF\xFFhttps://www.nytimes3xbfgragh.onion\x00\x00\x00\x00\x00\x00\x00\x00\x00\x00\x13\x00\xFF\xFF\x0C\x00
***snipped and edited for display***
It’s here that we start to get an idea that there is a lot of data to cover. In fact there are 92 records containing ‘onion’. We can clean up this output and get an idea of the unique entries.
dfir@LAPTOP:/mnt/c/BoH/output$ cat url.txt | grep "onion" | awk '{print $2}' | sort | uniq -c | sort -nr
     50 https://www.nytimes3xbfgragh.onion
     14 https://www.nytimes3xbfgragh.onion/
     10 https://www.nytimes3xbfgragh.onion/2018/03/17/world/asia/us-technology-smuggling-foreign-weapons.html?action=click&module=In%20Other%20News&pgtype=Homepage&action=click&module=Latest&pgtype=Homepage
      6 https:/01.graylady3jvrrxbe.onion
      6 https://et.nytimes3xbfgragh.onion
      2 https://pnytimes.chartbeat.net/ping?h=nytimes.com&p=%2F2018%2F03%2F17%2Fworld%2Fasia%2Fus-technology-smuggling-foreign-weapons.html%3Faction%3Dclick%26module%3DIn%2520Other%2520News%26pgtype%3DHomepage%26action%3Dclick%26module%3DLatest%26pgtype%3DHomepage&u=BbmfdHBIgFSHhtUPz&d=nytimes3xbfgragh.onion&g=16698&g0=World%2CAsia%20Pacific%2Cinternational_desk&g1=RON%20NIXON&n=1&f=00001&c=1.75&x
      2 https://3g2upl4pq6kufc4m.onion
      1 https://et.nytimes.com/?subject=page&url=https%3A%2F%2Fwww.nytimes3xbfgragh.onion%2F&assetUrl=https%3A%2F%2Fwww.nytimes3xbfgragh.onion%2F&referrer=&clientTimeStamp=1521372293400&totalTime=272800&evtUUID=35f71ccd-53d5-4880-8284-0ce4a04aaa7f&page_view_id=0307636b-421f-4866-9b06-6e73d188ba1a&performance=%7B%7D&presentation=%7B%22pageType%22%3A%22Homepage%22%2C%22program%22%3A%7B%22breakpoint%
      1 https://djdkduep62kz4nzx.onion.to/
Even though we only accessed one hidden service, https://www.nytimes3xbfgragh.onion, there are a number of other URLs and we need ascertain their relevance. A quick check of the URL prefix indicates that https://3g2upl4pq6kufc4m.onion is the DuckDuckGo search engine.

The URL https://djdkduep62kz4nzx.onion.to is definitely weird1. According to Malware Traffic Analysis (who incidentally have great PCAP challenges!) the URL was linked in 2015 to the TeslaCrypt ransomware.2 The server might have been temporarily compromised in 2015. However, now the site is inaccessible from either Tor2Web or Tor at the time of writing.

(As an aside the .to URL suffix with an hidden service indicates a Tor2Web address, which is a way for a user to access a Tor hidden service without running Tor. Dropping the .to will access the same site over the Tor network.)
The remaining onion URLs (https:/01.graylady3jvrrxbe.onion and https://www.nytimes3xbfgragh.onion) both relate to our tested browsing of the New York Times hidden service. However the large amount of URL records from simply browsing two pages reinforces the caveats on using Bulk Extractor for anything but lead generation.
Email Addresses
The amount of noise in Bulk Extractor extends to other identifiers such as email. Even with only basic browsing, the file email_domain_histogram.txt has 218 different email domains.
dfir@LAPTOP:/mnt/c/BoH/output$ cat email_domain_histogram.txt
# BANNER FILE NOT PROVIDED (-b option)
# BULK_EXTRACTOR-Version: 1.5.5 ($Rev: 10844 $)
# Feature-Recorder: email
# Filename: Win10_14393_Tor_Closed.vmem
# Histogram-File-Version: 1.1
n=212   @eff.org
n=40    @mozilla.org
n=34    @torproject.org
n=29    @gmail.com
n=20    @ime.sy
n=15    @mozilla.com
n=15    @suscerte.gob.ve
n=14    @chambersign.org
n=12    @trustcentre.co.za
n=10    @emas.me
n=10    @globaltrust.info
n=9     @diginotar.nl
***snipped***
One way to identify email domains of interest is to look a the frequency of the domain in the full URLs for the major webmail providers. The output file url_histogram.txt provides a frequency of URLs which can then be grepped against major webmail providers.
For Gmail we have two entries with low scores on the histogram (which may actually be mangled URLs concatenated together):
dfir@LAPTOP:/mnt/c/BoH/output$ cat url_histogram.txt | grep gmail
n=1     http://by137w.bay137.mail.live.com/mail/hiplight.aspx?n=http://bl103w.blu103.mail.live.com/mail/inboxlight.aspx?n=http://by142w.bay142.mail.live.com/mail/inboxlight.aspx?n=http://by137w.bay137.mail.live.com/mail/inboxlight.aspx?.mail.live.com/mail/[email protected]
n=1     http://[email protected]  (utf16=1)
There are similar low results for Hotmail and Yahoo, and some specialist providers like Tuta Nota or ProtonMail have no results. Searching for ‘live.com’ produced a number of interesting entries, but not all appear to be related to email.
dfir@LAPTOP:/mnt/c/BoH/output$ cat url_histogram.txt | grep live.com
n=24    https://xsts.auth.xboxlive.com  (utf16=21)
n=21    https://login.live.com/ (utf16=19)
n=20    https://login.live.com  (utf16=18)
n=11    https://xsts.auth.xboxlive.com/ (utf16=11)
n=8     https://onedrive.live.com/windows/      (utf16=5)
n=7     http://auth.xboxlive.com
n=7     http://xboxlive.com
n=7     https://account.live.com/       (utf16=5)
***snipped***
When we search for GMX we get a much larger and richer number of URLs, with much high scores in the histogram.
dfir@LAPTOP:/mnt/c/BoH/output$ cat url_histogram.txt | grep gmx
n=56    https://navigator-bs.gmx.com
n=46    https://3c-bs.gmx.com
n=38    https://dl.gmx.com
n=36    https://home.navigator-bs.gmx.com
n=36    https://trackbar.navigator-bs.gmx.com
n=27    https://mailderef.gmx.com
n=26    https://dl.gmx.com/uim/container/generic_dfp_gmxcom_1.html#id=0#url=https%3A//mailderef.gmx.com/dl.gmx.com/uim/container/generic_dfp_gmxcom_1.html#lcid=1521372556900233436.54056410247
n=21    https://3c-bs.gmx.com/mail/client/mail/sentconfirm;jsessionid=1E8359D02DBEE35F86F0FC0BDB82D44E-n1.bs08a?editorAction=NEW&mailId=tmai151d0045aebe9761&uc=SHOW_CONFIRMPAGE
n=20    https://3c-bs.gmx.com/mail/client/mail/detail;jsessionid=1E8359D02DBEE35F86F0FC0BDB82D44E-n1.bs08a?5&mailId=tmai151cfee574b629f3&page=0&sort=sort-DATE-desc&folderId=tfol151997642113d811
n=19    https://dl.gmx.com/uim/container/generic_dfp_gmxcom_1.html
n=16    https://3c-bs.gmx.com/mail/client/mail/compose/html?editorAction=NEW    (utf16=1)
n=14    https://navigator-bs.gmx.com/?sid=8f7b6d9796a1d87e18679305cba3fda03a827dbee2aa77e48455ce496cb3d5d7a81e4f34c4788802ecc6616ea4b28f69
***snipped***
The results also show a variety of URL parameters including words like ‘compose’, ‘session’ etc. which makes GMX mail more interesting. There are also references to parameter ‘sid’, which is likely a unique session identification hash. Testing on a throwaway GMX account indicates there likely is a new ‘sid’ for every login.

Now we can go back to the email.txt file and look for GMX emails.
dfir@LAPTOP:/mnt/c/BoH/output$ cat email.txt | grep gmx
dfir@LAPTOP:/mnt/c/BoH/output$
Nothing!
In the tradition of memory forensics there is no record for any GMX email account. Despite our hypothetical user logging into GMX mail and reading and writing messages, sometimes data simply isn’t in memory at the time of capture! This would be one to refer to the disk image or other sources of intelligence.
Network Traffic
Bulk extractor also carves network traffic data from memory, which can be interesting. This is saved as a .pcap file which can be read in tcpdump or Wireshark. Although for Tor traffic it is less of interest due to its encrypted nature and IP obfuscation.
In our scenario, there is no additional information gleamed from the Volatility netscan results with the same IP address, 54.37.17.235, recorded in the (mostly malformed) pcap traffic. The IP 40.77.228.92 resolves back to Microsoft.

‘Traditional’ data carving
One hindrance to memory forensics is that ‘traditional’ file carving usually doesn’t provide good results. This kind of file carving looks for hexadecimal headers and footers to extract data and is commonly used in disk forensics. However, unlike disk forensics, memory is fragmented and not all of the data may be in memory at the times of capture. The ‘bible’ of memory forensics explains this succinctly:
Occasionally, people still attempt to reconstruct a file from a memory sample using traditional file carving tools, such as Scalpel…Unfortunately, most of these tools assume the file data is contiguous and that the media being analyzed contains a whole copy of the file…As a result except for files smaller than one page of memory, you are probably not going to extract the data you expect.
The Art of Memory Forensics: Detecting Malware and Threats in Windows, Linux and Mac in Memory, p.494
So, if we tried, what would we get? Foremost is data carving utility which will carve picture, document, executables, ZIP/RAR, HTML or audio files. It is simple and quick to run and places each file type in output folders.
Here I will attempt to carve for picture and HTML data.
dfir@LAPTOP:/mnt/c/BoH$ foremost -t jpg,htm,gif,png -v -i Win10_14393_Tor_Closed.vmem -o foremost
Foremost version 1.5.7 by Jesse Kornblum, Kris Kendall, and Nick Mikus
Audit File

Foremost started at Tue May  1 09:31:44 2018
Invocation: foremost -t jpg,htm,gif,png -v -i Win10_14393_Tor_Closed.vmem -o foremost
Output directory: /mnt/c/BoH/foremost
Configuration file: /etc/foremost.conf
Processing: Win10_14393_Tor_Closed.vmem
|------------------------------------------------------------------
File: Win10_14393_Tor_Closed.vmem
Start: Tue May  1 09:32:12 2018
Length: 4 GB (4294967296 bytes)

Num      Name (bs=512)         Size      File Offset     Comment

0:      00009856.png           1 KB         5046368       (36 x 36)
1:      00009859.png           1 KB         5048104       (48 x 48)
2:      00092377.png          198 B        47297024       (50 x 50)
3:      00092378.png          224 B        47298032       (44 x 44)
4:      00092381.png          224 B        47299120       (44 x 44)
5:      00092383.png          136 B        47300160       (16 x 16)
6:      00104370.png          452 B        53437746       (16 x 16)
7:      00104371.png         1005 B        53438301       (32 x 32)
8:      00104373.png          485 B        53439397       (16 x 16)
9:      00144140.png          209 B        73799772       (9 x 5)
10:     00144141.png          215 B        73800560       (9 x 5)
***snipped***
560:    08269196_1.htm        236 B      4233828859
561:    08269197.htm          269 B      4233829195
562:    08269198.htm          247 B      4233829563
563:    08269199.htm          250 B      4233829915
564:    08269199_1.htm         3 KB      4233830267
565:    08269206.htm          281 B      4233833931
566:    08214113.gif           6 KB      4205626344       (1168 x 769)
567:    08212180.png          353 B      4204636576       (310 x 150)
568:    08212182.png          502 B      4204637616       (310 x 150)

Finish: Tue May  1 09:32:33 2018

569 FILES EXTRACTED

jpg:= 1
htm:= 41
gif:= 23
png:= 504

Foremost finished at Tue May  1 09:32:33 2018
Data was ‘found’ but as expected, the results are limited. No useful HTML or picture files were located. However, it did carve a number of small icons which could potentially be useful to either identify a hidden service of interest (e.g. a logo or a user avatar). For cases of child exploitation Foremost could be of greater interest, but ultimately it’s not the solution.
If we want to ‘carve’ files in memory we can return to Volatility and use the dumpfiles plugin. The syntax is vol.py -f <filename> --profile=<profile> dumpfiles -n -D ./<output_path> -r <regex_value> Here the -n appends the name of the original file and -r is using a regular expression to limit the output.
Results may still be limited. My attempts to locate HTML, GIF, JPG, and sqlite files all fail to locate any data.
However turning to Windows system files, using dumpfiles against Event Logs produced a good output to examine.
dfir@LAPTOP:/mnt/c/BoH$ vol.py -f Win10_14393_Tor_Closed.vmem --profile=Win10x64_14393 dumpfiles -n -D ./dump -r .evtx
Volatility Foundation Volatility Framework 2.6
DataSectionObject 0xffff80814be1c460   908    \Device\HarddiskVolume1\Windows\System32\winevt\Logs\System.evtx
SharedCacheMap 0xffff80814be1c460   908    \Device\HarddiskVolume1\Windows\System32\winevt\Logs\System.evtx
DataSectionObject 0xffff80814be23080   908    \Device\HarddiskVolume1\Windows\System32\winevt\Logs\Application.evtx
SharedCacheMap 0xffff80814be23080   908    \Device\HarddiskVolume1\Windows\System32\winevt\Logs\Application.evtx
DataSectionObject 0xffff80814be24c80   908    \Device\HarddiskVolume1\Windows\System32\winevt\Logs\Security.evtx
SharedCacheMap 0xffff80814be24c80   908    \Device\HarddiskVolume1\Windows\System32\winevt\Logs\Security.evtx
***snipped***
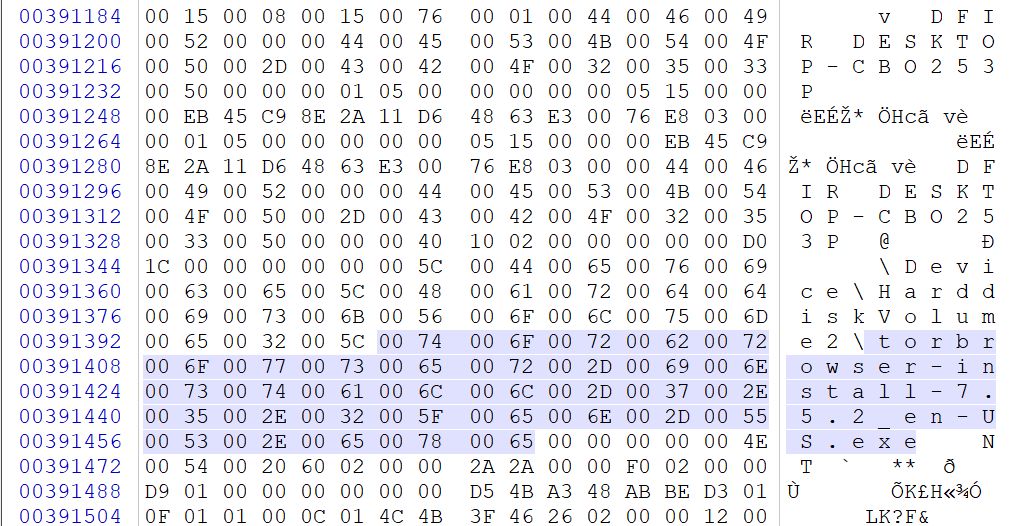
Located in the Security Event log was a reference to torbrowser-install-7.5.2_en-US.exe.

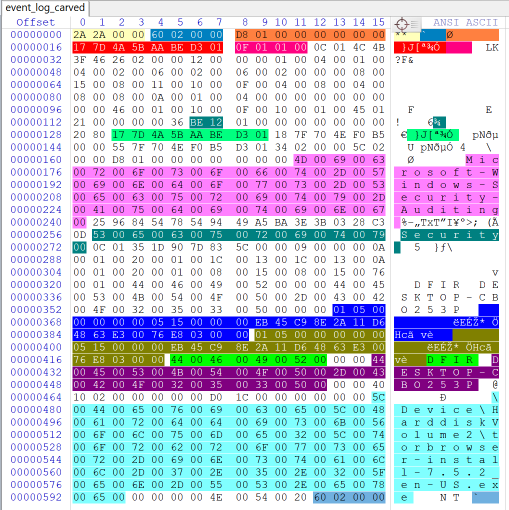
As the log was only partially complete, as is common, and Windows Event Log Viewer failed load the log to view it natively. By reviewing baseline data (being logs from my Windows installation) and handy research previously done here, the key fields (for this log) can be broken down as follows:
| Offset (decimal) | Data Type | Length (bytes) | Hex Data | Converted Data / Comment |
|---|---|---|---|---|
| 0 | Event Record Signature | 4 | 2A2A0000 | Hex Signature |
| 4 | Event Record Size | 4 | 60020000 | 608 bytes (LE) |
| 8 | Event Record Identifier | 8 | D801000000000000 | 472 (LE) |
| 16 | Windows FILETIME written | 8 | 177D4A5BAABED301 | 18 March 2018, 11:15:00 UTC |
| 24 | Binary Data Header | 4 | 0F010100 | Hex Signature |
| 118 | Event ID | 2 | BE 12 | 4798 |
| 130 | Windows FILETIME event created | 8 | 177D4A5BAABED301 | 18 March 2018, 11:15:00 UTC |
| 171 | Event Log Provider Name | 70 | UTF-16 | N/A |
| 257 | Event Log Channel | 16 | UTF-16 | N/A |
| 365 | Target SID | 28 | 010500000000000515000000 EB45C98E2A11D64863E30076E8030000 | S-1-05-5-21-2395555307- 705812040-1221988650-1979769699-1000 |
| 393 | Subject User SID | 28 | 010500000000000515000000 EB45C98E2A11D64863E30076E8030000 | S-1-05-5-21-2395555307- 705812040-1221988650-1979769699-1000 |
| 421 | Subject User Name | 8 | UTF-16 | N/A |
| 431 | Subject User Domain | 30 | UTF-16 | N/A |
| 479 | Caller process name | 116 | UTF-16 | N/A |
| 604 | Event Record Size (Footer) | 4 | 60020000 | 608 bytes (LE) |
Which corresponds to the event log fragment as follows:

The actual event (in this circumstance) is not particularly interesting ‘Event 4798 - A user’s local group membership was enumerated’. The presence of the log and the FILETIME stamp provides another interesting data point for a timeline. It also provides additional information that the Tor Browser Bundle installer was located on HarddiskVolume2, which may or may not be the same USB as the installed files. The date stamp, 18 March 2018, 11:15:00 UTC, indicates that the timing is definitely consistent to the other timestamps identified in this analysis (e.g. from the $MFT).
Having taken the time to parse out the hex in the event log fragment, I thought it might be useful to carve similar Event Log fragments via a script. The result is a simple Python script, event_carver.py, which searches a binary file (usually a .evtx file that is corrupted or zero padded) and locates the event record signature x\2Ax\2Ax\00x\00. It will then parse and extract some key fields including the record offset within the file, event log ID, and timestamp. The event fragment is then dumped into an ‘output’ folder for manual inspection.
(It certainly doesn’t appear to be as comprehensive as either EVTXract or python-evtx neither of which I have tested at this time.)
The output looks as follows:
c:\Scripts\event_carver>python event_carver.py test.bin
Located header at offset: 0x1200
Located header at offset: 0x1cf0
Located header at offset: 0x31200
Located header at offset: 0x31b48
Located header at offset: 0x31d78
Located header at offset: 0x321f0
Located header at offset: 0x32458
**snipped**
Located header at offset: 0x5f938
Located header at offset: 0x5fc28
Located header at offset: 0x60020
Located header at offset: 0x60310

Located 139 Windows Event Record fragments
Event carver completed at 10:45:39, 08-May-2018
The output folder will appear as:
c:\Scripts\event_carver\output>dir /d /b
events_summary.csv
offset_0x1200_2018-03-08.bin
offset_0x1cf0_2018-03-08.bin
offset_0x31200_2018-03-07.bin
offset_0x31b48_2018-03-07.bin
offset_0x31d78_2018-03-07.bin
**snipped**
The script should only be used as a first triage, as it’s blindly looking at values that may be empty or corrupted. At this stage there is significant variability in the remaining binary content of the EVTX record so I haven’t yet attempted to parse this data out. (Otherwise, I’d never get this post out!)
Summary
There is almost endless analysis that could be done with the Bulk Extractor output. Most likely (and useful) is to put the output into a word list which you can then run over the physical image or against password protected files. This could either be a selection of data, or through enabling the word list option on initial processing via bulk extractor -e wordlist -o <output directory> <source file>.
Traditional data carving is unlikely to produce quality results, as the testing with Foremost demonstrated. Instead, using Volatility dumpfiles can assist.
That’s all for this two-part series on analysing Tor artefacts in memory images. In traditional DFIR fashion it started as looking at Tor and ended with carving event records. You never know where you end up!
Please feel free to share your thoughts or comments at [email protected] or via Twitter at @mattnotmax. Thanks for reading!
Related Links
Bulk Extractor
Foremost
DCode
Incorporating Disk Forensics with Memory Forensics - Bulk Extractor (proof that everything old is new again!)
Monkey Unpacks Some Python (thanks for the Python tips!)
python-evtx
-
Not a technical term to put in the final report! ↩︎
-
See https://www.malware-traffic-analysis.net/2015/09/02/index.html ↩︎
