We verify our forensic tools, right? And once we verify them, it’s all good? But what if the application is lying? Is the forensic tool right or wrong?
I was playing around with HTTP/2 to see how the protocol works. A more detailed post examining HTTP/2 is forthcoming, but as usual I went down a rabbit hole and ended up…well, writing a Chrome bug report. But I’ll take a few steps back.
HTTP/2 Background
HTTP/2 is the protocol that replaces the text-based HTTP/1.x protocol that we all know and love. HTTP/2 is a binary, multiplexed, stream-based protocol. In other words: completely different.
All major browsers can easily handle HTTP/2 and the per cent of HTTP/2 traffic is actually quite large. Figures that I found from April 2016 indicated HTTP/2 comprised 68% of web-traffic. Even the lowly bit_of_hex blog is sent via HTTP/2.
As part of the forthcoming post, I created a simple webpage on a VPS serving basic content over HTTP/2. In doing my testing, I ran Nirsoft ChromeCacheView and Ryan Benson’s Hindsight over the Chrome cache which was used to access the website to examine the results.
It was then I noticed something weird. Let’s explore further.
Using Chrome version 67.0.3396.99 (x64) on Windows 10 x64 (1803) and accessing an HTTP/2 page like https://http2.akamai.com/ I can confirm the data is being transmitted via HTTP/2 using Chrome Developer Tools.
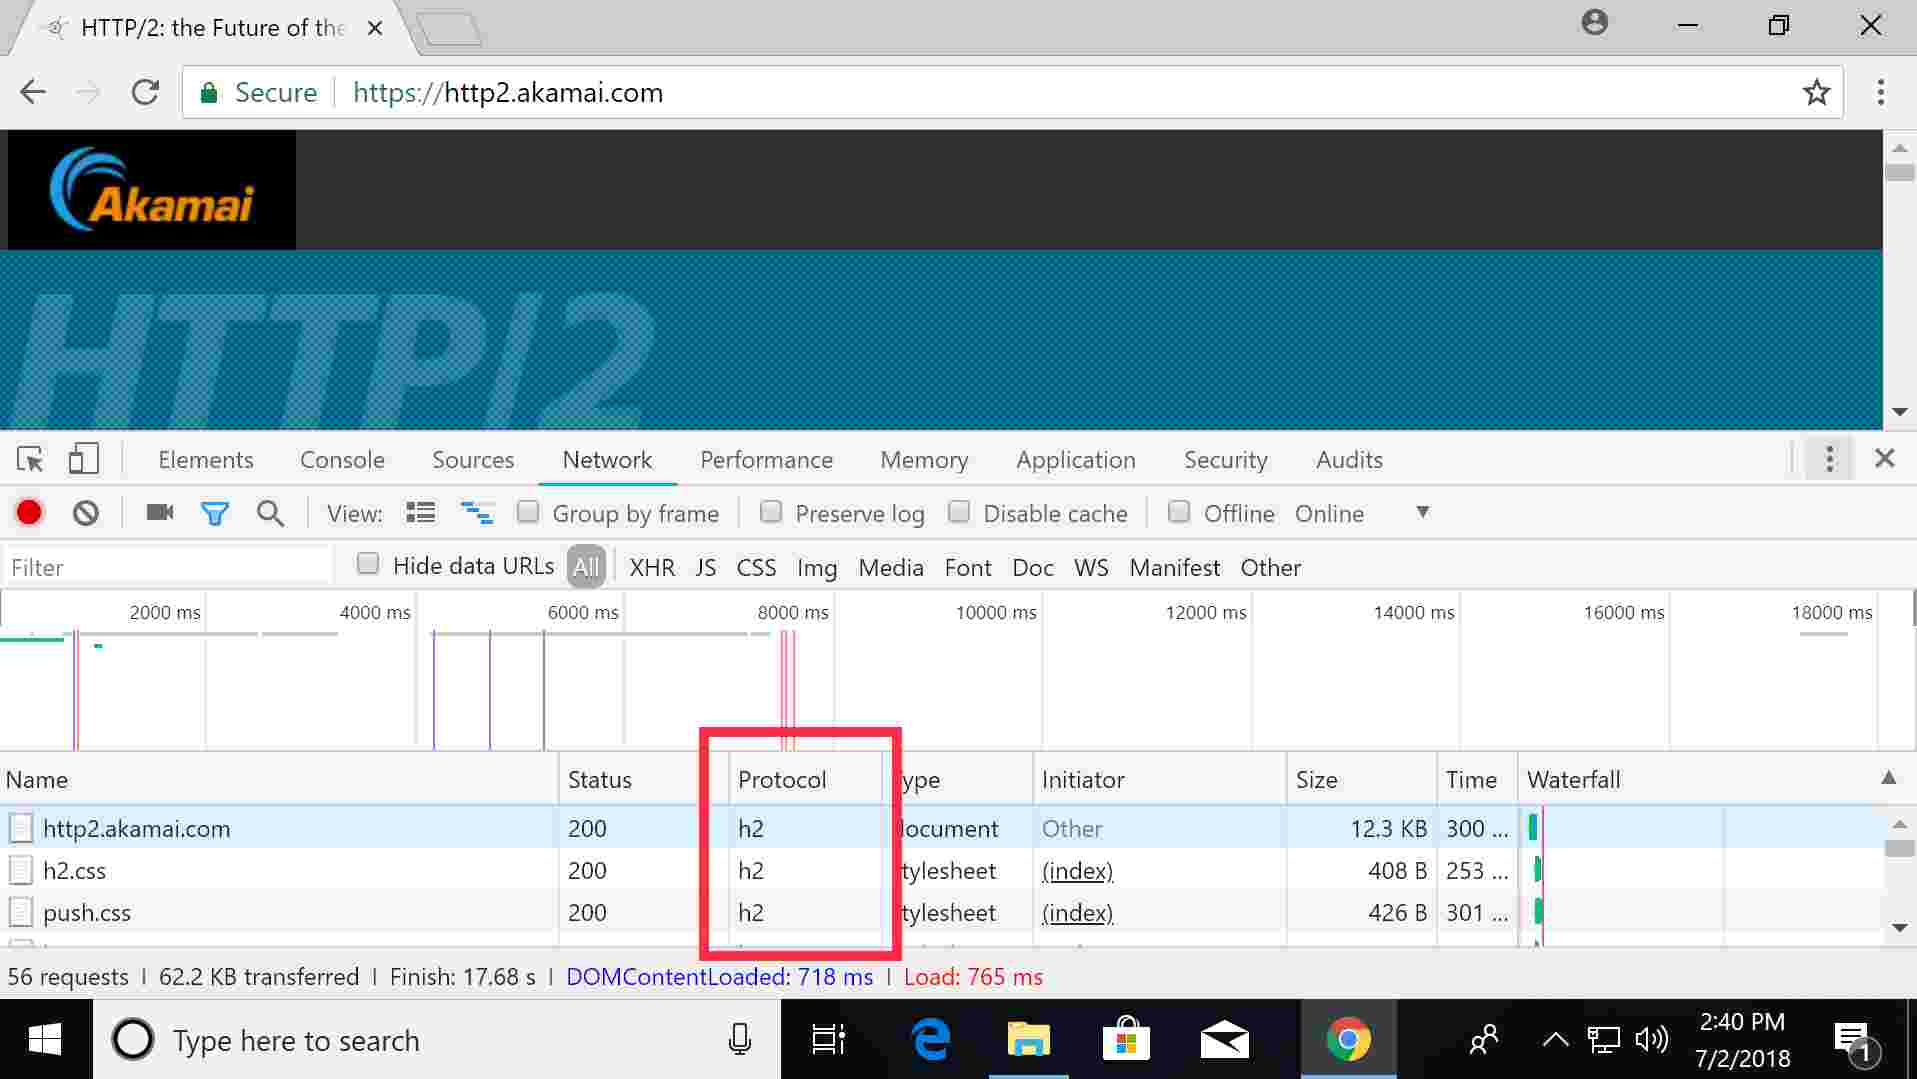
From the above, the three highlighted data elements are served over ‘h2’ (which is the shorthand for HTTP/2). Developer Tools also allows a user to look at the server response headers (which are too long for a good screenshot, so you’ll have to trust me):
accept-ch: DPR, Width, Viewport-Width, Downlink, Save-Data
access-control-allow-credentials: false
access-control-allow-headers: *
access-control-allow-methods: GET,HEAD,POST
access-control-allow-origin: *
access-control-max-age: 86400
cache-control: max-age=43200
client_ip: 203.0.113.1
client_real_ip: 203.0.113.1
content-length: 11932
content-type: text/html;charset=UTF-8
date: Mon, 02 Jul 2018 04:34:03 GMT
etag: "9068c20f1c727825919f58f136cdfb91:1506554442"
expires: Mon, 02 Jul 2018 16:34:03 GMT
ghost_ip: 23.49.208.45
ghost_service_ip: 203.26.28.251
myproto: h2
protocol_negotiation: h2
push: true
rtt: 49
server: Apache
status: 200
strict-transport-security: max-age=31536000 ; includeSubDomains
x-akamai-transformed: 9 10909 0 pmb=mRUM,1
This response header is actually quite detailed, and does include the protocol type ‘h2’ (lines 17 & 18). However, according to RFC 7540, 8.1.2.4 there is no requirement for HTTP/2 to declare the protocol version in the response header.
For HTTP/2 responses, a single “:status” pseudo-header field is defined that carries the HTTP status code field…This pseudo-header field MUST be included in all responses; otherwise, the response is malformed.
HTTP/2 does not define a way to carry the version or reason phrase that is included in an HTTP/1.1 status line.
In contrast, for the response headers served via HTTP/1.1 it is required (according to RFC 2616, Section 3.1) to announce the version number (such as HTTP/1.1), as in this example from http://www.abc.net.au/news/.
HTTP/1.1 200 OK
X-UA-Compatible: IE=Edge
Content-Type: text/html;charset=UTF-8
Content-Language: en-AU
Content-Encoding: gzip
Content-Length: 35230
Last-Modified: Mon, 02 Jul 2018 04:59:59 GMT
Accept-Ranges: bytes
Cache-Control: max-age=21
Expires: Mon, 02 Jul 2018 05:03:50 GMT
Date: Mon, 02 Jul 2018 05:03:29 GMT
Connection: keep-alive
Vary: Accept-Encoding
Set-Cookie: ABC_LD=vic; path=/; domain=.abc.net.au
Set-Cookie: ABC_FF=desktop; expires=Mon, 02-Jul-2018 07:03:29 GMT; path=/
Vary: Origin
Vary: Cookie
Vary: User-Agent
Vary: User-Agent
So, what’s the big deal?
Well the problems start when you look at what browser forensic tools pull out from the cache. In the https://http2.akamai.com/ instance, using Nirsoft gets the following (edited) results:
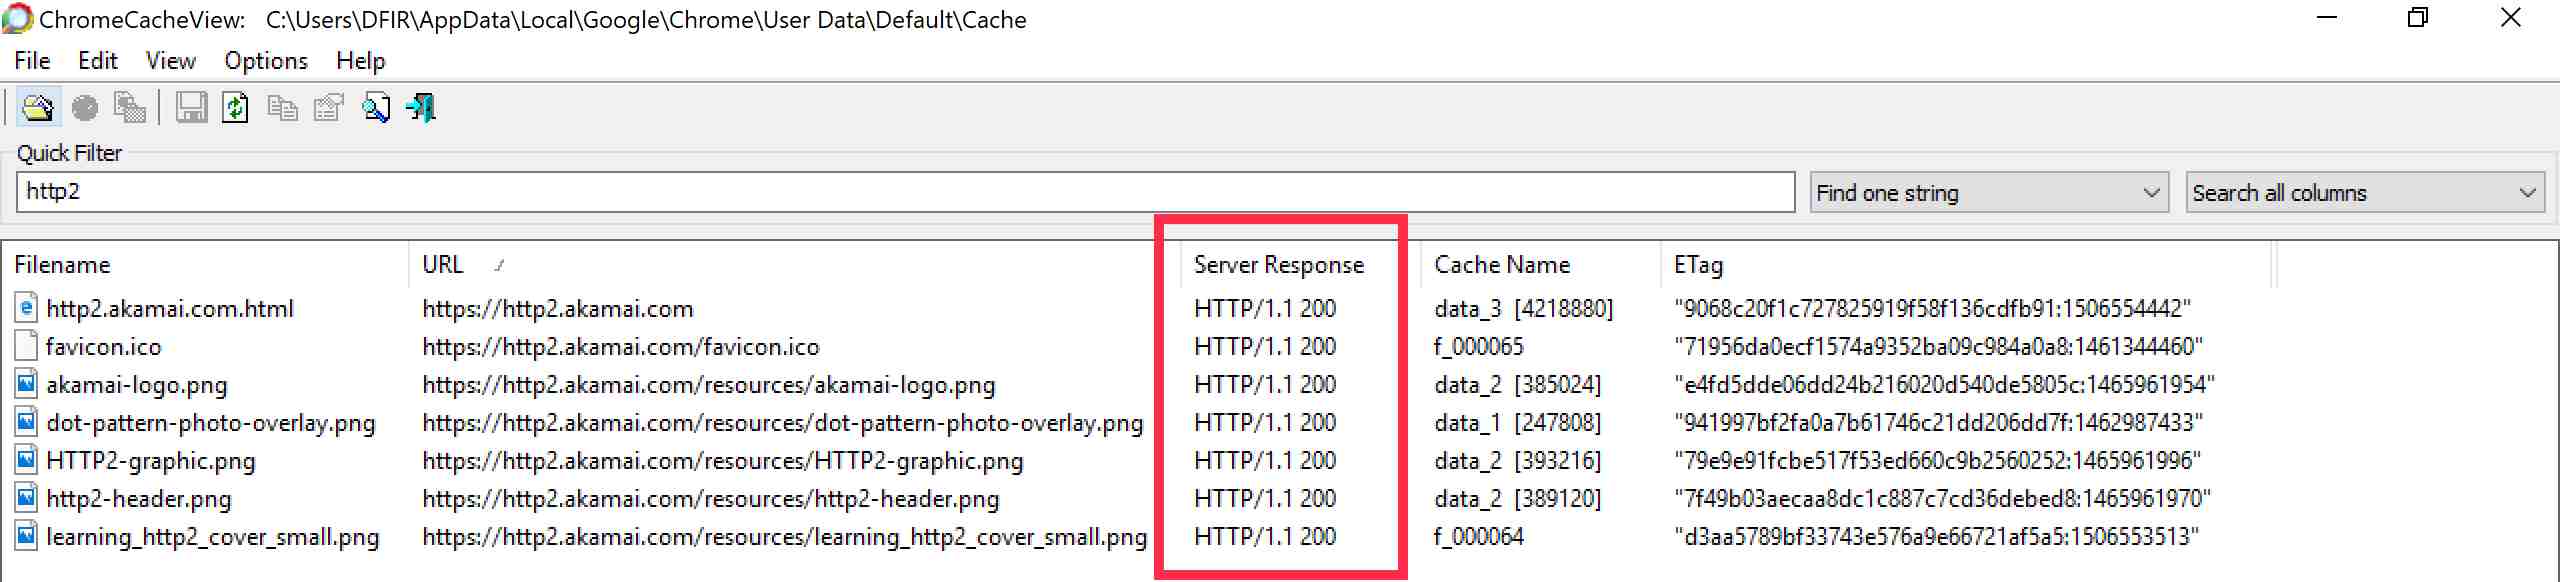
It’s wrong. We know and saw from Chrome Developer Tools that it was served over HTTP/2. The response header also stated ‘h2’. Damn these forensic tools! Wrong again; because here is the entry in the referenced data_3 file in the Chrome cache (at C:\Users\{User}\AppData\Local\Google\Chrome\User Data\Default\Cache\):
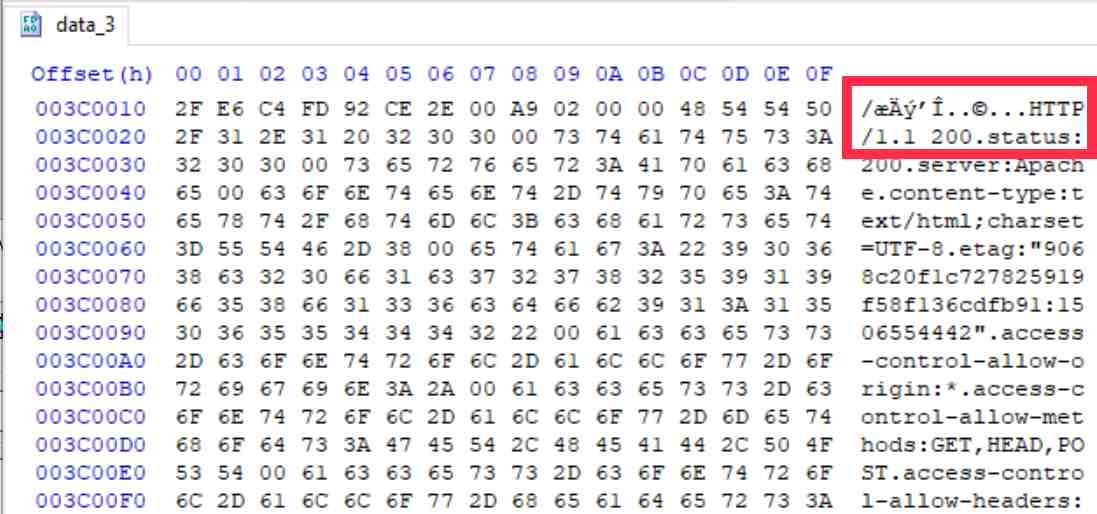
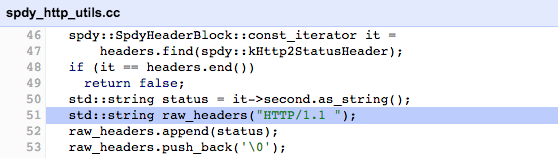
So, Chrome is writing ‘HTTP/1.1’ at the top of the cache entry? This seems strange indeed and therefore blame isn’t with the forensic tools. Why this gets written there is a mystery to me. At the end of this block of information in the data_3 file is a reference to ‘h2’ which likely indicates the protocol. However, I haven’t done the required testing to confirm how this is used.
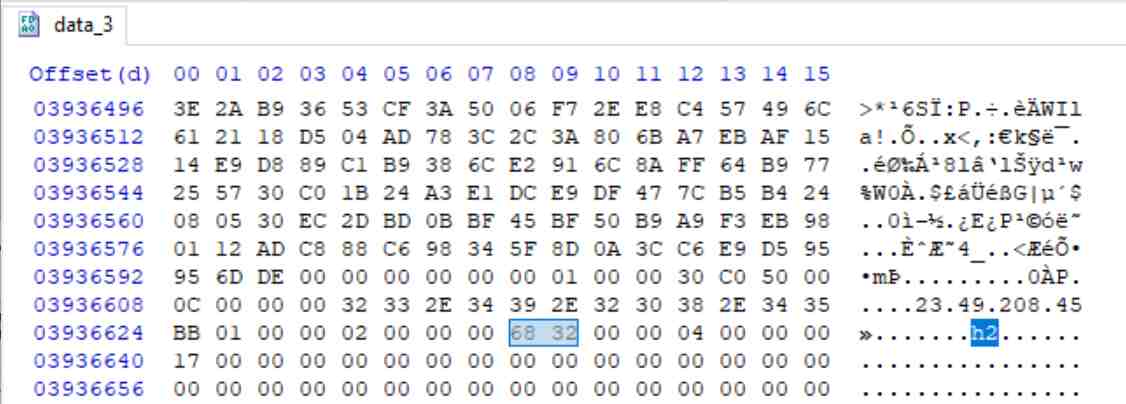
So, I lodged a bug report to see what the experts at Google thought. They quickly triaged this issue to a hard-coded line that injects the string ‘HTTP/1.1’ within the code:
So, what is the impact of this? It goes back to the old issue of verification and not simply ‘cut and pasting’ your tool output to your report. Based on this initial testing I can’t verify the response header protocol information stored in the Chrome cache. Is the tool wrong? Yes, but only because the application is lying.
If anyone has further insights, please drop me a line at [email protected] or via Twitter at @mattnotmax.